E-trash Management Threats Vector Design Guide
Visualizing the complex intersection of technology and environmental impact requires more than just stock photography. The E-trash Management Threats Vector template serves as a critical communication tool for professionals tasked with explaining digital sustainability, data security risks, and recycling workflows. This resource is specifically engineered to bridge the gap between technical cybersecurity concepts and accessible visual storytelling. By leveraging a structured infographic template, designers and educators can transform abstract threats into tangible, actionable narratives that resonate with stakeholders, clients, and students.
The core value of this vector asset lies in its ability to simplify without dumbing down. Electronic waste management is not merely about physical disposal; it involves intricate data sanitization processes, regulatory compliance, and supply chain security. A high-quality vector template provides the architectural framework needed to present these layers clearly. Whether you are designing an annual ESG report, a cybersecurity training module, or a public awareness campaign, starting with a professionally structured layout ensures your message maintains integrity across all formats.
Deconstructing the 5-Step Data Visualization Workflow
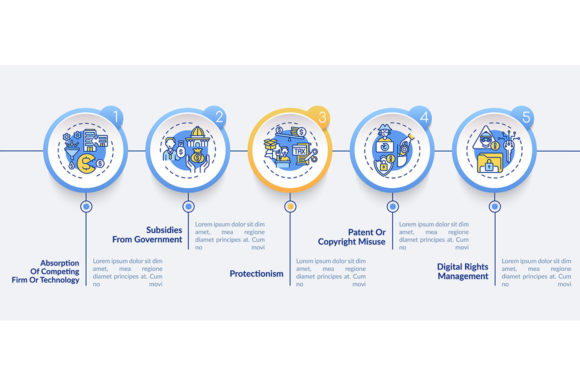
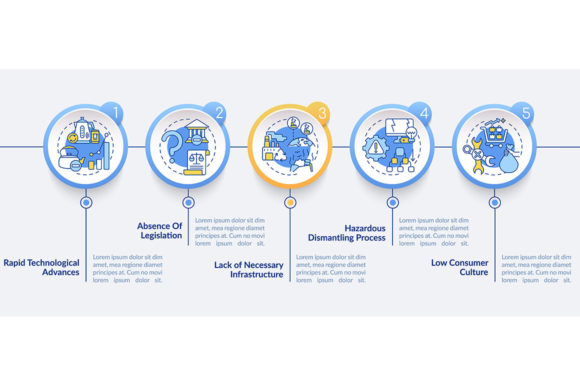
Effective e-waste communication relies on logical progression. The included 5-step process timeline chart is designed to guide viewers through the lifecycle of secure device retirement. When adapting this workflow layout, consider how each step represents a distinct phase of risk mitigation and resource recovery. This linear icon system allows for modular customization, enabling you to swap generic labels for organization-specific protocols while maintaining visual consistency.
- Assessment and Triage: Use the first node to visualize initial auditing. This is where devices are categorized by data sensitivity and material value. Custom icons here might include diagnostic tools or sorting bins to represent the decision-making gate.
- Data Sanitization: The second step addresses the primary threat vector. Visual representations should distinguish between software wiping, degaussing, and physical destruction. Clarity here builds trust with audiences concerned about privacy breaches.
- Component Harvesting: Highlight the circular economy aspect. This stage focuses on extracting reusable parts before recycling. Linear icons depicting circuit boards or batteries help emphasize value retention over simple disposal.
- Material Recovery: Visualize the industrial processing phase. This step connects corporate policy to environmental outcomes, showing how raw materials re-enter the manufacturing cycle.
- Certification and Reporting: Conclude the timeline with compliance. Icons representing certificates, audit logs, or digital dashboards reinforce accountability and close the loop on the management process.
Adapting Rapid Tech Advances Presentation Elements
Technology evolves faster than most design assets can keep up. The rapid tech advances presentation design elements included in this package address this challenge by offering abstract, futuristic motifs that remain relevant regardless of specific hardware generations. Instead of illustrating obsolete smartphones or legacy servers, these elements focus on connectivity, flow, and systemic integration. This approach future-proofs your presentations against the next product release cycle.
For marketers and bloggers covering the tech industry, these elements provide a sophisticated backdrop for discussing emerging e-waste challenges like IoT proliferation or AI server decommissioning. The aesthetic balances technical precision with modern minimalism, avoiding the cluttered look often associated with engineering diagrams. By using scalable vector graphics, you ensure that these forward-looking visuals remain crisp whether displayed on a mobile blog post or projected onto a conference hall screen.
Creative Applications Across Professional Contexts
Versatility is essential for creative professionals managing multiple client verticals. The E-trash Management Threats Vector template adapts to diverse objectives when approached with intention. Educators can utilize the workflow layout to teach computer science ethics or environmental policy, breaking down dense regulations into digestible visual sequences. The linear icon set works exceptionally well for slide decks where cognitive load must be minimized to maintain student engagement.
Corporate trainers and HR departments face the unique challenge of making compliance interesting. Rather than relying on text-heavy manuals, use the process timeline chart to create interactive training materials. Each step can serve as a prompt for scenario-based learning, where employees identify potential threat vectors in simulated environments. For freelancers and small business owners offering IT consulting services, incorporating these professional-grade visuals into proposals signals expertise and attention to detail, differentiating your services from competitors who rely on generic clip art.
Technical Flexibility: Maximizing File Format Utility
The inclusion of EPS, JPG, PNG, SVG, and AI files within the ZIP archive is not redundant; it is a strategic feature for multi-platform publishing. Understanding when to deploy each format is crucial for maintaining quality and optimizing performance. Scalable Vector Graphics (SVG) are the gold standard for web-based infographics and responsive design. They allow for CSS manipulation, meaning you can animate individual steps of the workflow or change color schemes dynamically based on user interaction or dark mode preferences.
Adobe Illustrator (AI) and Encapsulated PostScript (EPS) files serve as your master source documents. These are essential for deep customization, such as altering the geometry of icons or integrating brand-specific typography. High-resolution JPG and PNG formats act as immediate deliverables for contexts where vector support is limited, such as certain social media platforms, email newsletters, or printed handouts. Maintaining this format hierarchy ensures your E-trash Management Threats Vector assets remain accessible to collaborators who may not have specialized design software while preserving editability for future iterations.
Maintaining Clarity in Complex Threat Narratives
When visualizing threats, there is a temptation to overcomplicate designs to demonstrate thoroughness. Resist this urge. The most effective infographics prioritize signal over noise. Use the template’s negative space strategically to prevent visual fatigue. Color coding should be functional rather than decorative; assign specific hues to distinct threat categories or process stages to create an intuitive visual language that reduces the need for excessive labeling.
Consistency in line weight, icon style, and typography creates a sense of professional authority. If you modify the provided linear icons, ensure new additions match the original stroke width and corner radius. Inconsistent styling undermines credibility, especially when presenting to technical audiences who notice details. Test your adaptations at various sizes to confirm legibility. A workflow chart that looks perfect on a desktop monitor may become illegible when embedded in a PDF report or viewed on a tablet. Always validate your design decisions against the end-user’s viewing context.
Strategic Storytelling Through Visual Hierarchy
Beyond mere illustration, this template facilitates strategic storytelling. The arrangement of elements guides the viewer’s eye through a narrative arc. Position the most critical threat vectors or key performance indicators at focal points within the composition. Use directional cues inherent in the process timeline to suggest movement and progress. This transforms static information into a dynamic journey, helping audiences understand not just what the steps are, but why their sequence matters.
For entrepreneurs pitching sustainable tech solutions, this narrative capability is invaluable. You can overlay financial projections or environmental impact metrics directly onto the workflow structure, correlating operational efficiency with positive outcomes. The template becomes a canvas for demonstrating ROI, making abstract sustainability goals concrete and measurable. By anchoring your data within a recognized visual framework, you reduce friction in stakeholder understanding and accelerate buy-in.
Originality Within Structured Frameworks
Using a template does not mean sacrificing originality. Think of the E-trash Management Threats Vector as a foundation rather than a constraint. Combine the provided linear icons with custom photography or proprietary data visualizations to create hybrid compositions unique to your brand. Experiment with layering, opacity, and blending modes to add depth without clutter. The goal is to leverage the template’s structural strengths while injecting your distinctive perspective and voice.
Stay grounded in utility. Every modification should serve a communicative purpose. If adding a decorative element does not enhance understanding or reinforce branding, omit it. Practical creativity means solving problems elegantly. When your audience walks away with a clearer understanding of e-waste management protocols and reduced anxiety about data security, the design has succeeded. This balance of aesthetic appeal and functional clarity defines professional-grade visual communication in the sustainability sector.